Bruteforce Analysis
Introduction #
Recently I set up this Website as a small side Project in order to learn a little bit of HTML, CSS and the use of static site generators. In order to host this website I used my VPS I own on IONOS. As someone who has spent a lot of time in the Cybersecurity world, I gave my best to secure the VPS as well as possible. Login via SSH is enabled only via Private/Public Key Authentification and Fail2Ban is setup to ban anyone who tries to login more than 5 Times. Once this was setup I created a way to “pull” the logs from nginx and fail2ban onto my private ProxMox server and Process these into Grafana. As I was doing this, I noticed that the fail2ban logfile has over 31.000 rows. Nothing suspicious for a public IP Address, yet a interesting amount of data.
After getting my hands on these files I decided that I will try to parse and analyse these bruteforce attacks. Furthermore this will be written in go, because I am trying to hone my skills in it and it allows us to write extremely efficient, fast and lightweight code.
Data #
The dataset (fail2ban.log file) consists of relatively simple and understandable logs. Here is a snippet of the average log section:
// I will not be exposing the IP addresses for obvious reasons
2025-10-25 17:04:35,850 fail2ban.filter         [77278]: INFO    [sshd] Found xxx.xxx.xxx.xxx - 2025-10-25 17:04:35
2025-10-25 17:04:36,414 fail2ban.actions        [77278]: WARNING [sshd] xxx.xxx.xxx.xxx already banned
2025-10-25 17:04:37,099 fail2ban.filter         [77278]: INFO    [sshd] Found xxx.xxx.xxx.xxx - 2025-10-25 17:04:36
2025-10-25 17:04:40,100 fail2ban.filter         [77278]: INFO    [sshd] Found xxx.xxx.xxx.xxx - 2025-10-25 17:04:39
2025-10-25 17:04:40,420 fail2ban.actions        [77278]: NOTICE  [sshd] Ban xxx.xxx.xxx.xxx
There are also some error entries in the log file which are not clearly labeled, although not as important for the data analaysis part, need to be considered when parsing:
2025-10-25 17:04:40,426 fail2ban.utils          [77278]: ERROR   7f57b0136b10 -- exec: { iptables -w -C f2b-sshd -j RETURN >/dev/null 2>&1; } || { iptables -w -N f2b-sshd || true; iptables -w -A f2b-sshd -j RETURN; }
for proto in $(echo 'tcp' | sed 's/,/ /g'); do
{ iptables -w -C INPUT -p $proto -m multiport --dports 22  # or your custom SSH port -j f2b-sshd >/dev/null 2>&1; } || { iptables -w -I INPUT -p $proto -m multiport --dports 22  # or your custom SSH port -j f2b-sshd; }
done
Implementation #
The following will be separated into three sections: Parsing, Data Collection and Visualization
Parsing & Regex ##
I decided the most simple way to go forward is to save the logs into a JSON file, with an object for each log entry. This simplifies the writing and reading of the same file in the future. In go we do this by defining a struct with tags for how the JSON structure will look like in the future:
type Logs struct {
	Timestamp string  `json:"timestamp"`
	Handler   string  `json:"handler"`
	Level     string  `json:"level"`
	Source    string  `json:"source"`
	IpAddress  string  `json:"ipAddress"`
	Message   string  `json:"message"`
}
These are the key value fields we will want to fill with the information from the log file. The log file is read with golangs os and bufio packages. With these we open the log file and pass it to a scanner instance. The scanner then gives us a multitude of functions to handle the reading of the file.
The most simple way is to create a for loop like this:
for scanner.Scan() {

  line := scanner.Text()

  ...
}
This ensures that in each iteration of the loop, the line variable is given the next row until none are available. line now contains a row from the log file.
Now comes the parsing. I have decided that I hate myself and that I will use Regex Expressions in order to find and extract the usual values in the fail2ban logs. For this I defined a Regex Expression for each of the above mentioned json tags, these being1:
// For (probably much) better efficiency these expressions can be grouped into one large expression with matching groups for each field.
// Because I do not like Regex, I will not do this.
dateRegex, _ := regexp.Compile(`\d{4}-\d{2}-\d{2}`)
handlerRegex, _ := regexp.Compile(`fail2ban\.\w+`)
ipRegex, _ := regexp.Compile(`(\b25[0-5]|\b2[0-4][0-9]|\b[01]?[0-9][0-9]?)(\.(25[0-5]|2[0-4][0-9]|[01]?[0-9][0-9]?)){3}`)
levelRegex, _ := regexp.Compile(`\s*(?:[A-Z]+)\s+`)
serviceRegex, _ := regexp.Compile(`\s*(?:\[[a-z]+\])\s+`)
actionRegex, _ := regexp.Compile(`(Found|already banned|Ban|Unban)`)
In theory this ruleset applied on the line variable should extract values like this:
2025-10-25 17:04:35,850 fail2ban.filter         [77278]: INFO    [sshd] Found xxx.xxx.xxx.xxx - 2025-10-25 17:04:35
[       dateRegex      ][ handlerRegex ]         [levelRegex][serviceRegex][actionRegex][ipRegex]
And therefore export it into a clean json:
...
{
   "timestamp": "2025-10-25 17:04:35,850",
   "handler": "fail2ban.filter",
   "level": "INFO",
   "source": "[sshd]",
   "ipAddress": "xxx.xxx.xxx.xxx",
   "message": "Found"
}
...
While writing, rewriting and fixing my code I also kept an eye on performance. I wrapped my parser function call in two time.Now().UnixMilli() in order to calculate how long it would take to parse the 31.456 lines. My best result floated around 580 ms which means my code can appropox. parse 55.000 rows in one second or given the file is 3.6MB it can parse appropox. 6.2MB per second in one stream. (Your results may vary, depending on hard drive, single core cpu performance etc.)
And there we go, I have written a very simple fail2ban log to json parser. From now on it gets easier (and more performant).
Analysing ##
In order to analyse the data we have collected, I will read our json file containing all the logs and creating a new file which aggregates the different log messages by IP Address. This means we will create a new struct which looks like this:
type StatsByIp struct {
	IpAddress      string  `json:"ipAddress"`
	TotalLogs      int     `json:"totalLogs"`
	TotalFound     int     `json:"totalFound"`
	TotalBanned    int     `json:"totalBanned"`
	TotalUnbanned  int     `json:"totalUnbanned"`
	Country        string  `json:"county"`
}
Note: If you ever use golangs encoding/json to handle Marshalling and Unmarshaling of the Json files yourself, note that you need to name your variables with Uppercase Letters. Go uses Uppercase/Lowercase to distinguish if your variable or function are public or private. Naming only the struct with Uppercase is not enough and if you do not do this, the inbuilt json.Marshal() and json.Unmarshal() functions will not work, as well as some other quirks if you use external functions and pointers.
Once these values have been aggregated by IP Address, we can see how often which IP has failed to auth on our SSH server and how often it has been Banned and Unbanned.
For extra information I have implemented a simple script to query the source country of the IP Address. This is done easily with public apis like ipadress.com. Although this is nice information to have, it is not 100% correct, as IP addresses change and on the day we query it does not have to belong to the same user 10 or more days ago when the log found it.2
Visualising ##
Static ###
I am a big sucker for Data Science and have used Python for most of my time Developing “Software”. The first tool which comes to mind when thinking of visualising data is pythons matplotlib. I have used this in all Data Science adjacent project, all through to my Bachelors Thesis. Therefore I was happy to find out go had a similar package out there. For this I have used gonum/plot. With it I created a simple wrapper function for creating bar plots, and collected all relevant data from our analytics steps. The most amount of individual IPs comes from China with a total count of 180 Individual IP Addresses. Taking a look at the most amount of bans, the chart looks like this:
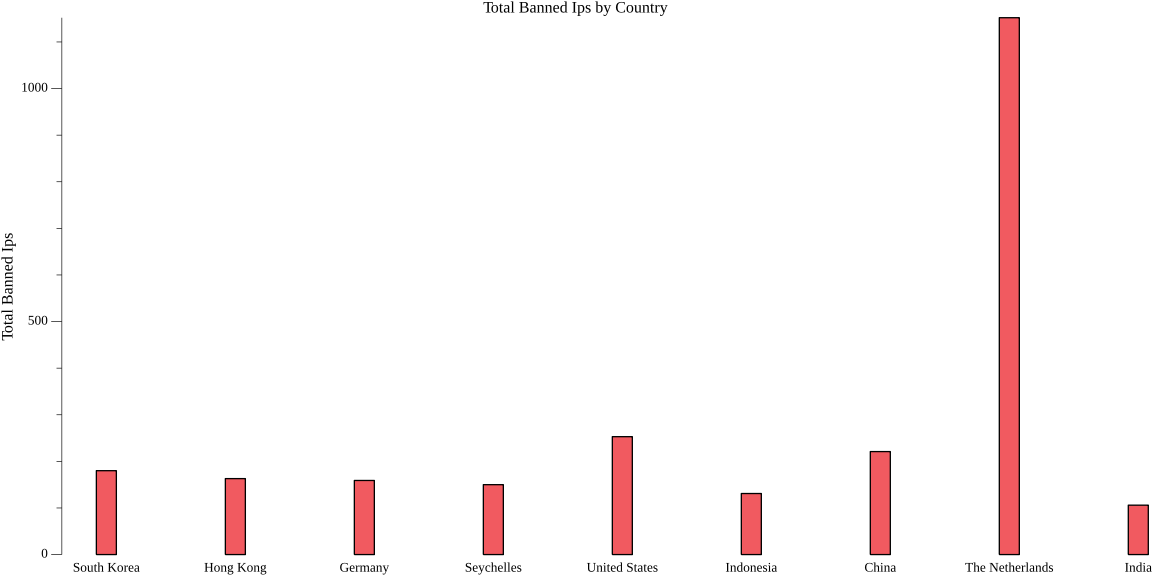
Interestingly the IPs from Netherlands are leading the race in trying to connect and authentificate on my VPS.
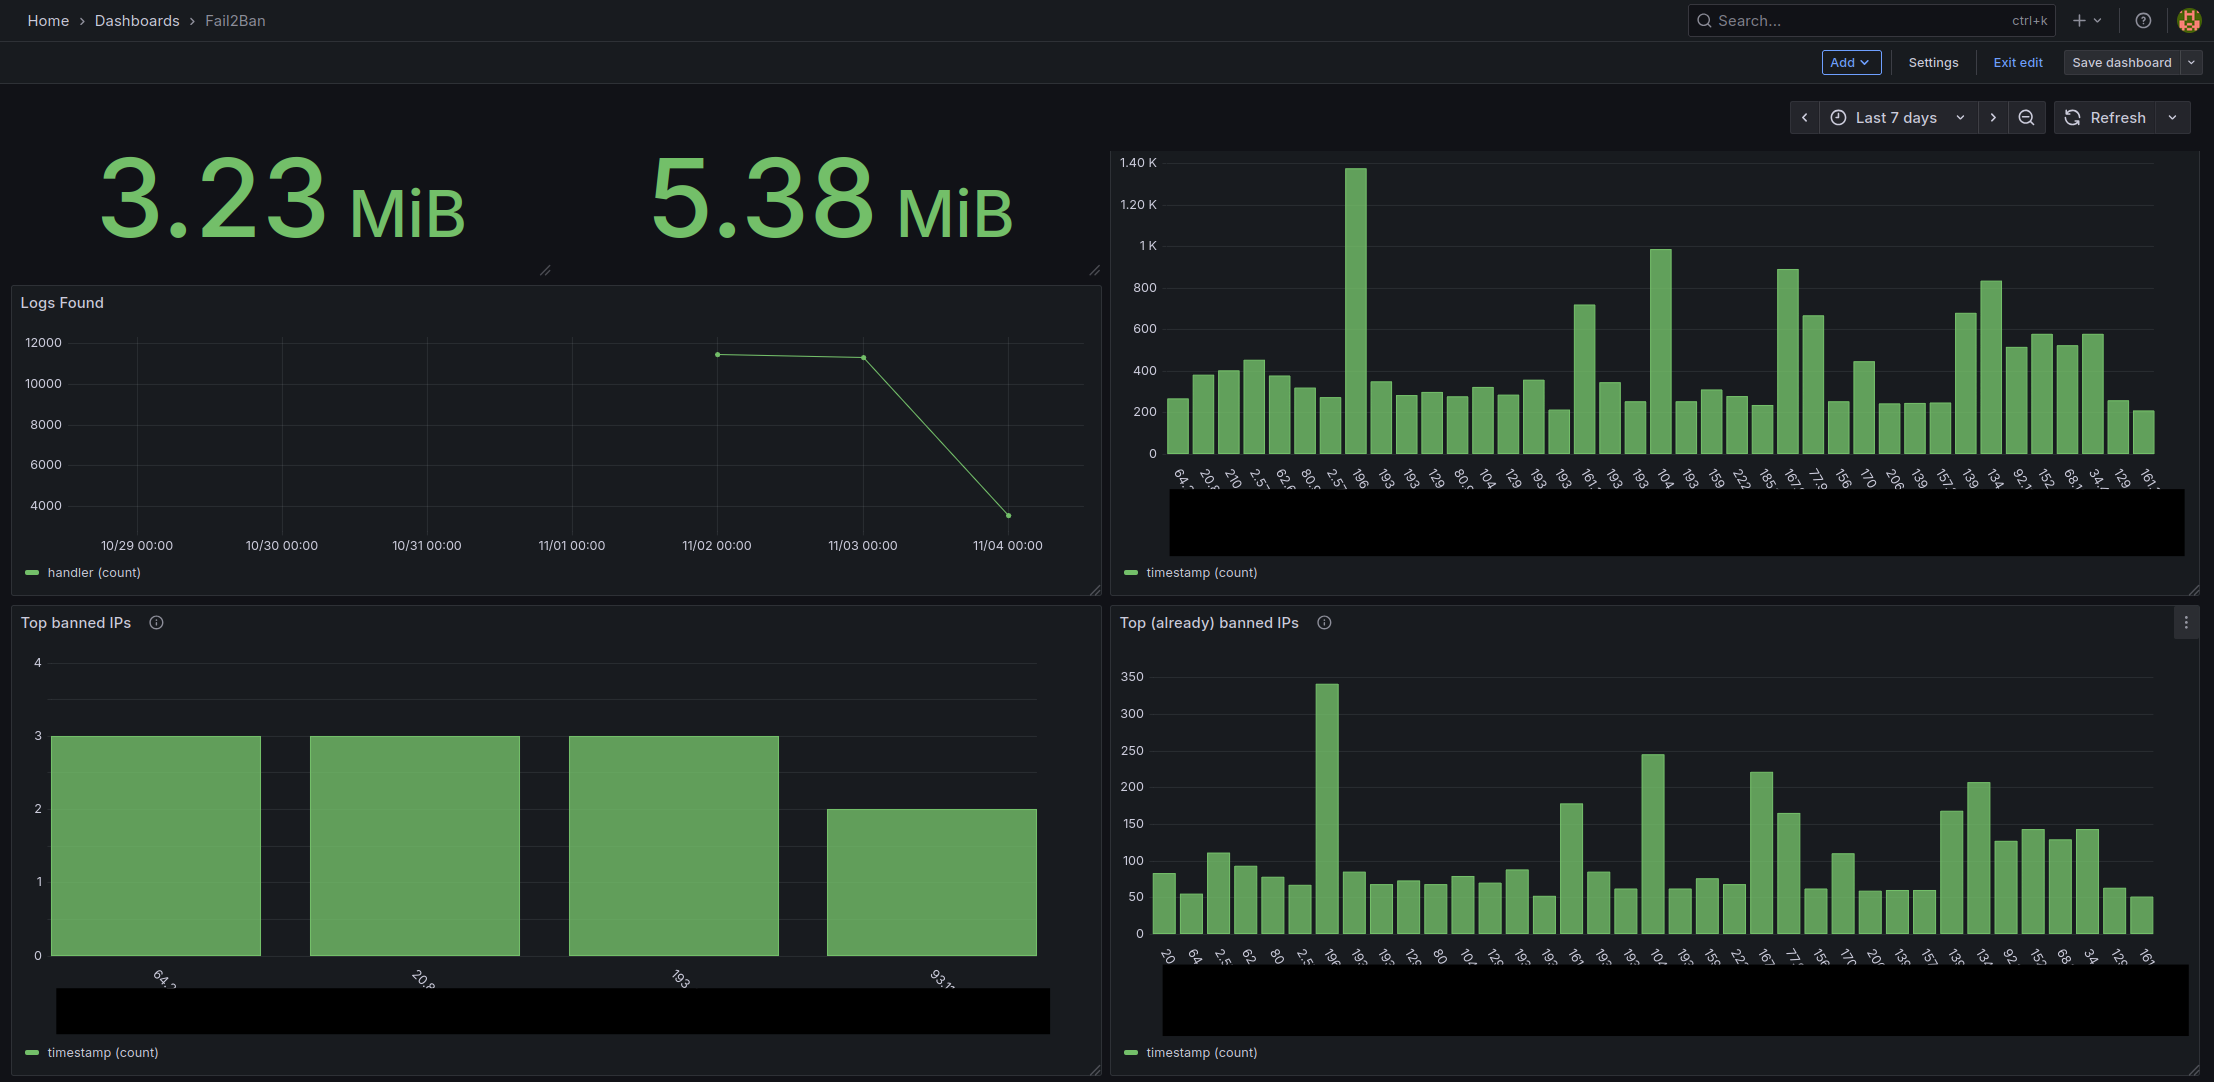
Dynamic ###
A few days later I looked at this and decided I want to integrate it into a Dashboard and have my data shown to me live. In order to do this I rewrote the parsing function so that it tracks the last byte it read in the log file. Now I can automate the syncing of the logs from my VPS and running my log parser in a LXC Container in which I deployed Grafana. Through Grafana I setup JSON Files as a Data Source (also needed to set up a simple python http server to serve the parsed json through REST API) and started creating a Dashboard.
All in all an interesting short project. One day I will give myself the challenge to optimize the code as much as possible.
Post Scriptum #
No text, images, code, concepts or ideas were created with Slop Generators3. Although I do not believe that Slop Generators are inherently bad nor do I believe that they cannot be used in a productive matter (as do I in some cases), everything I write on here are things which genuinely interest me and I want to create and work on by myself. I believe a person can only become better at the thing they are doing if they do not constantly search for instant gratification, which is often given to one when using Slop Generators.